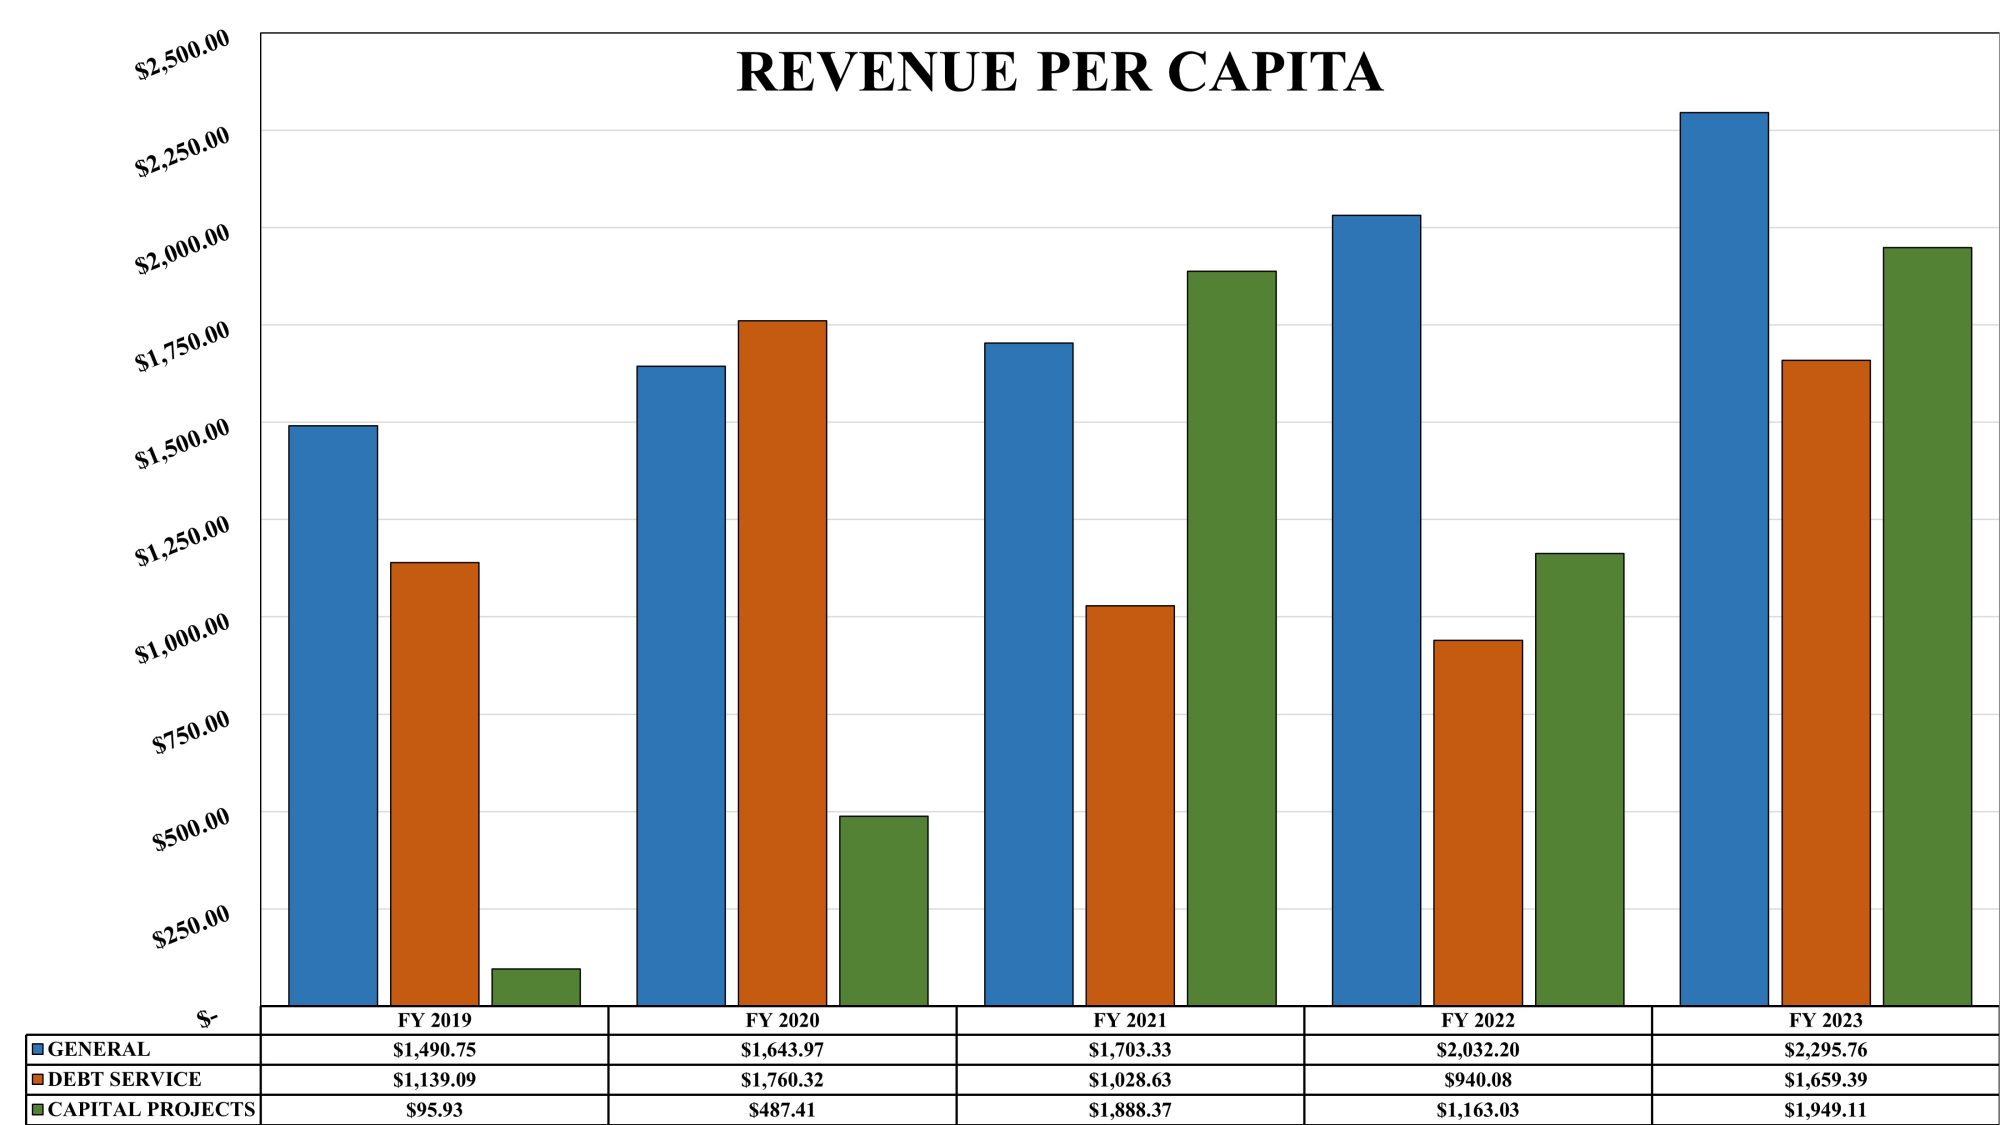
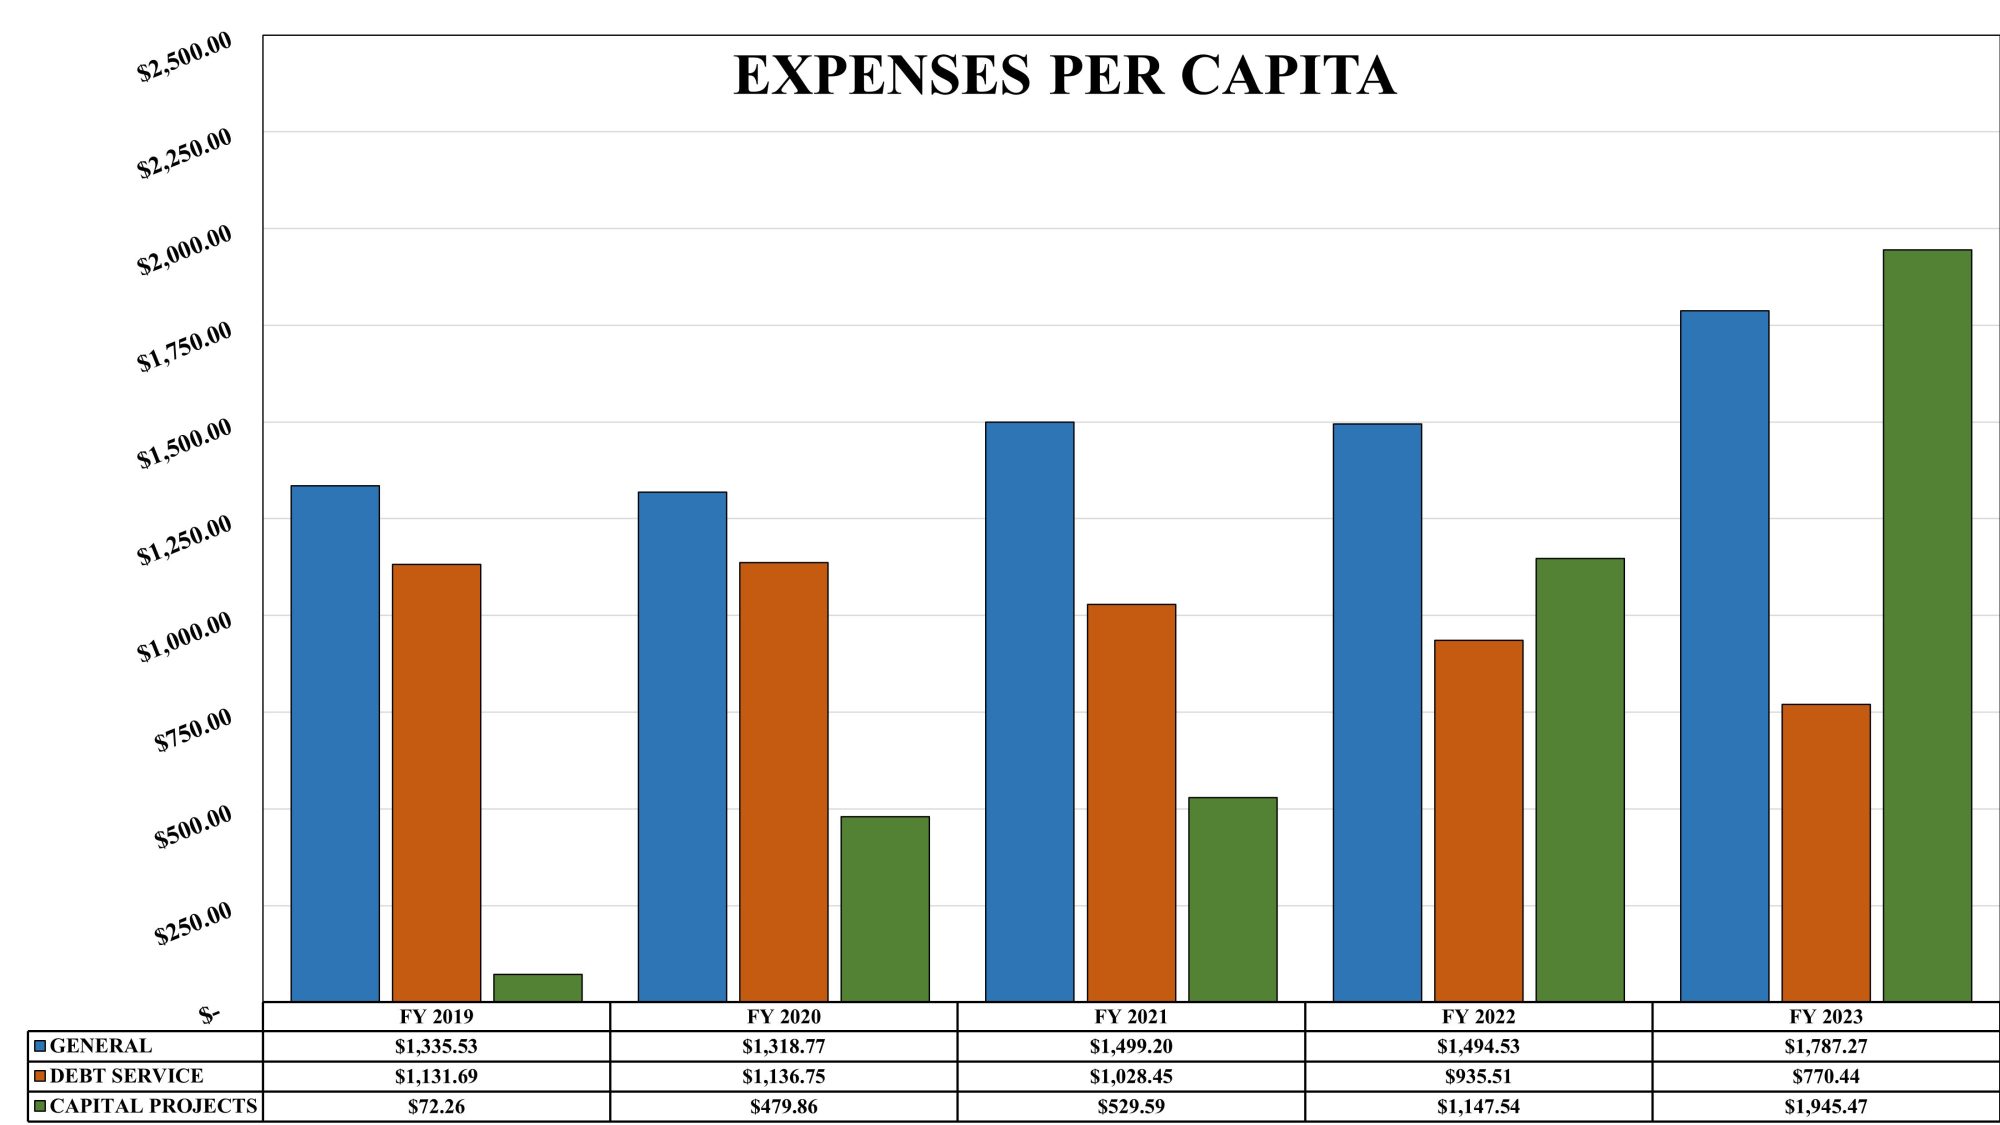
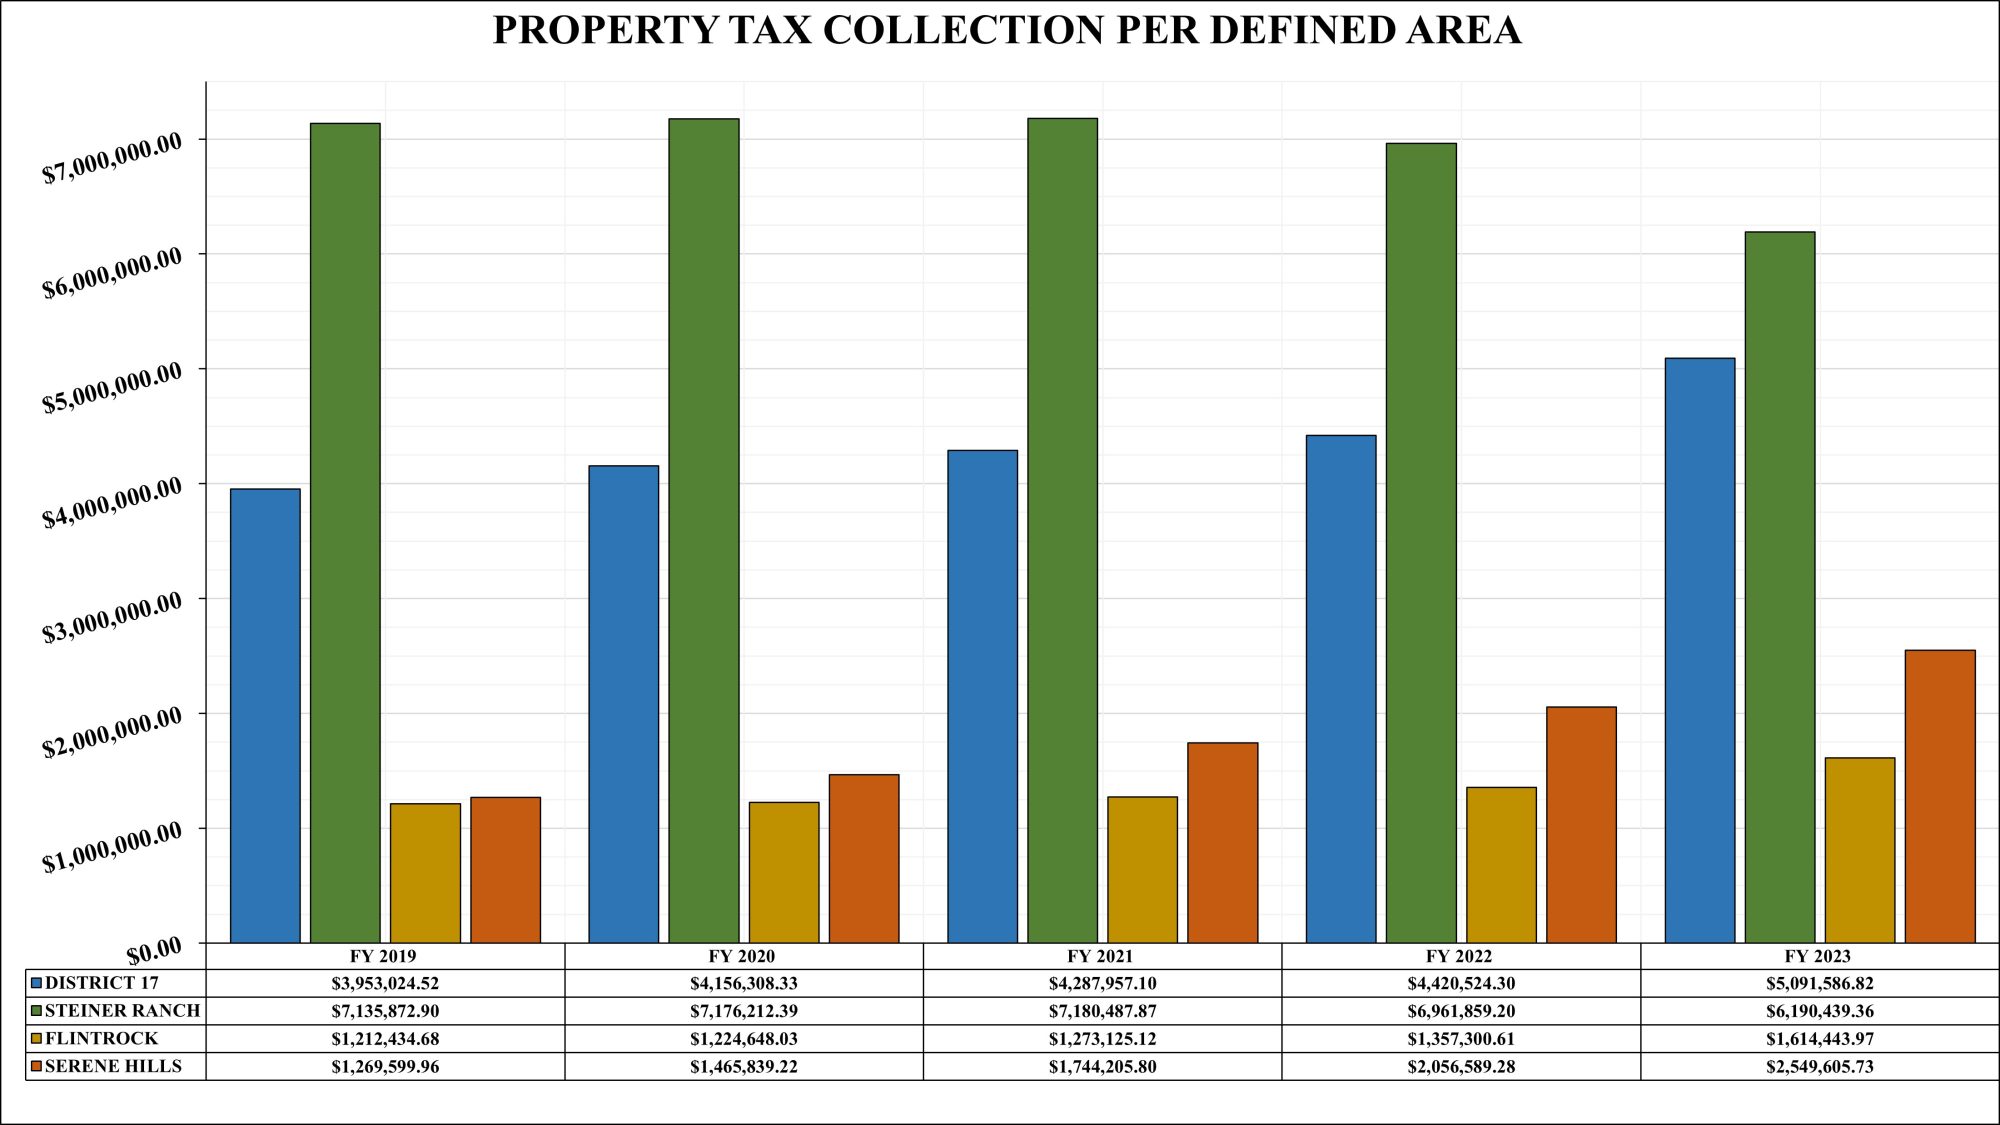
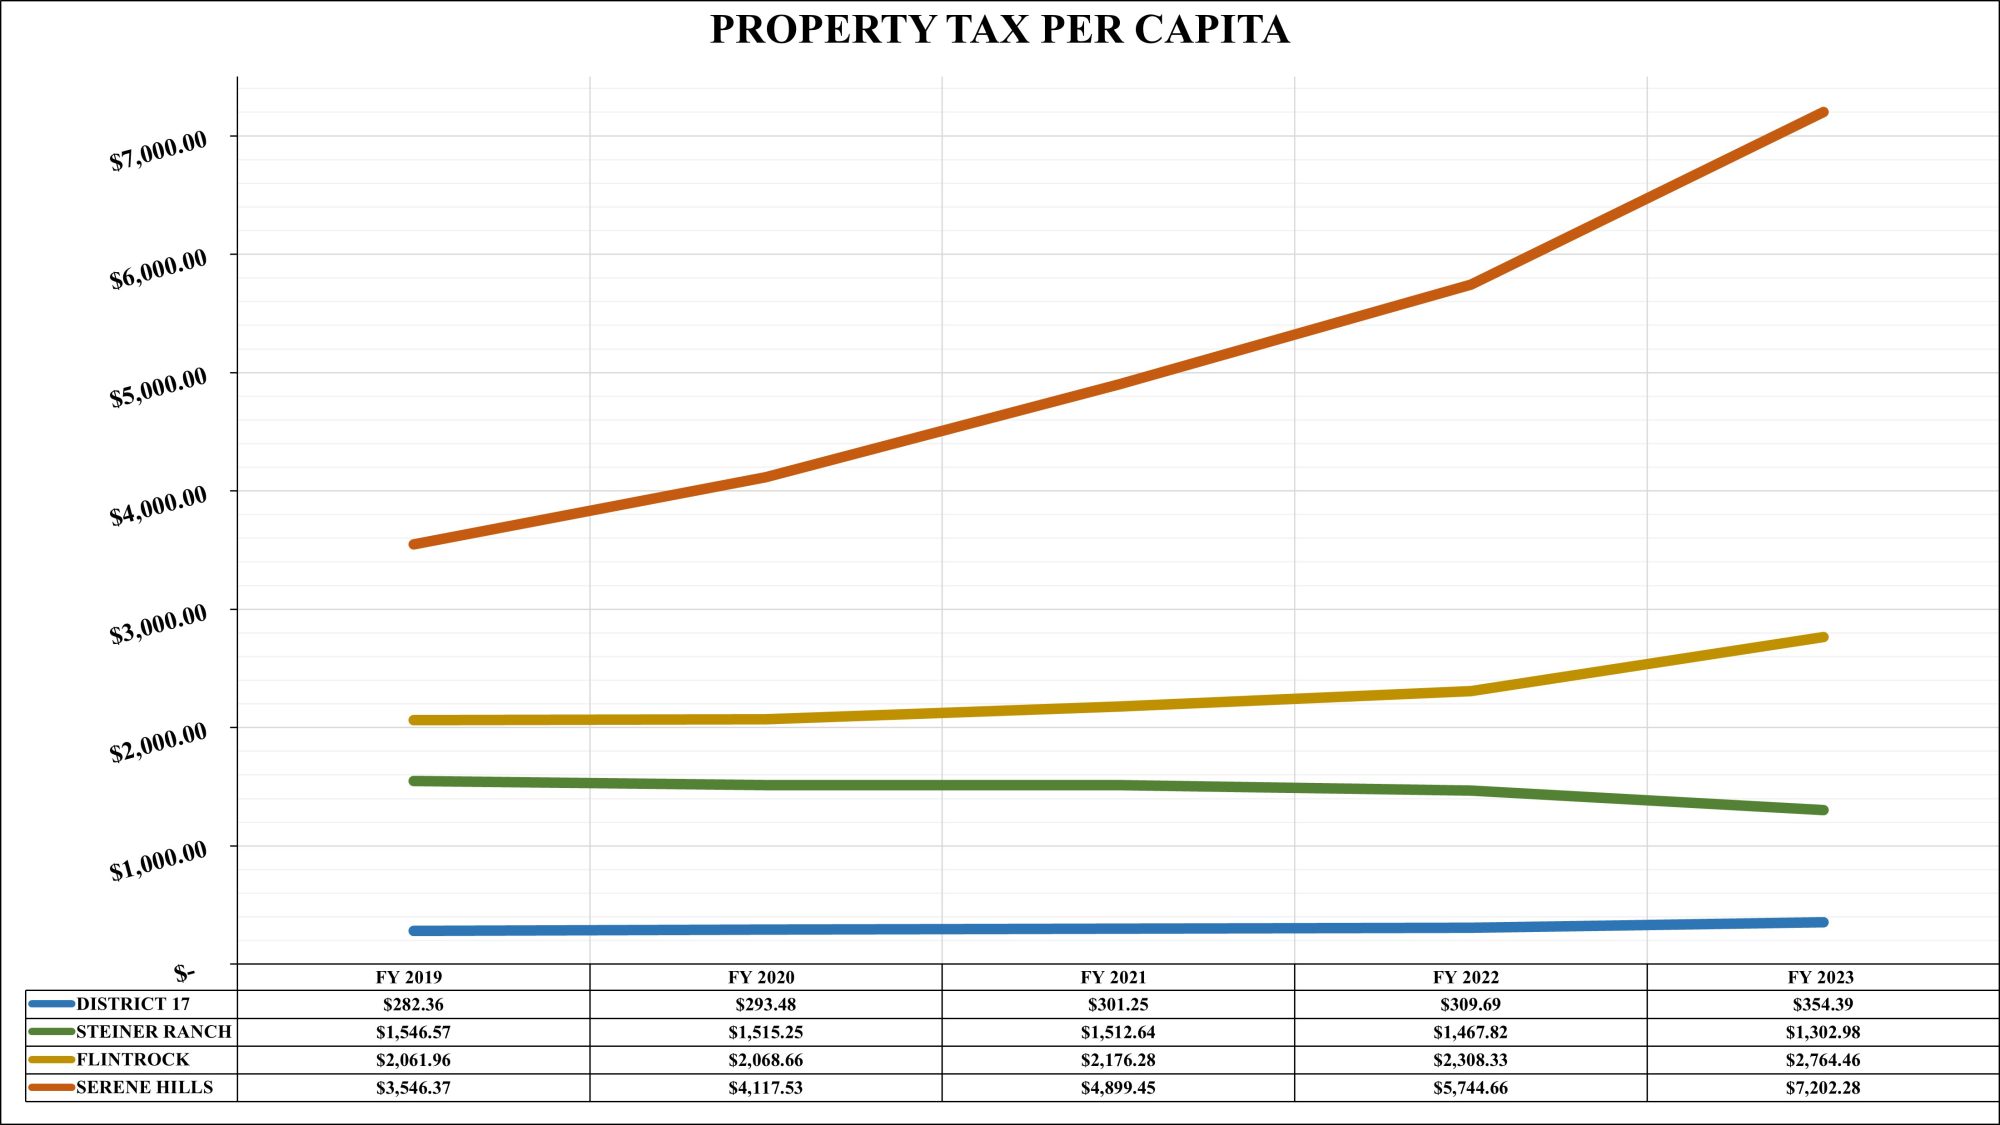
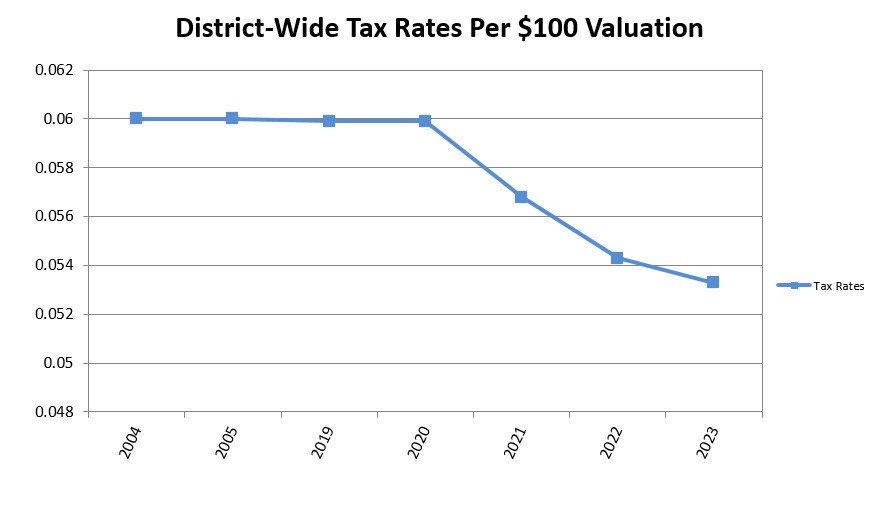
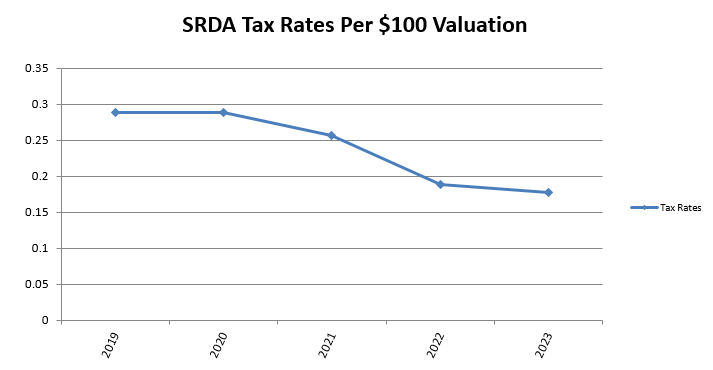
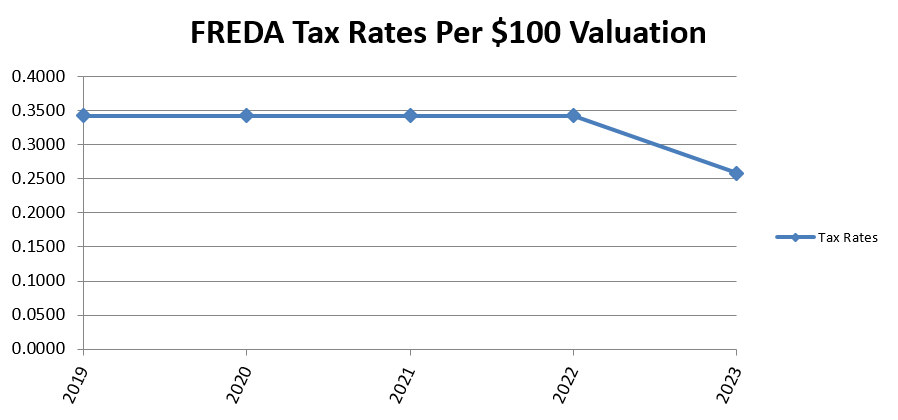
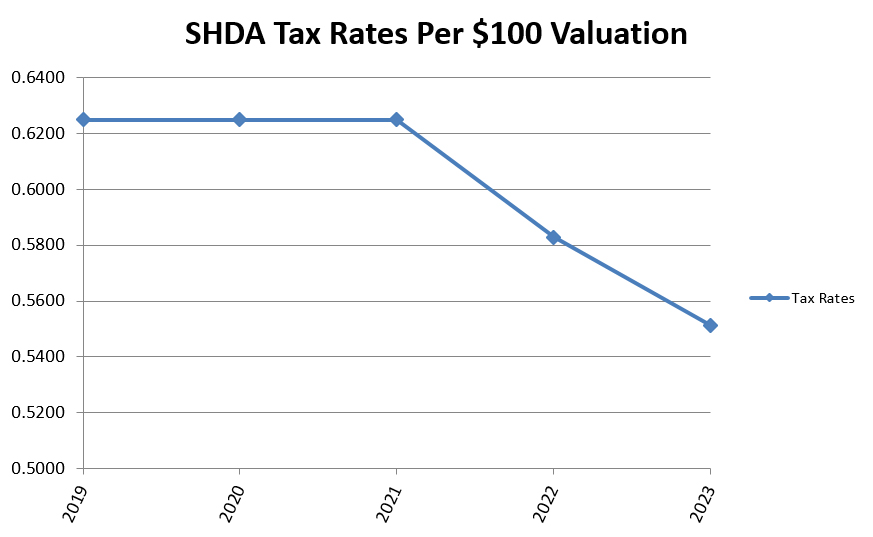
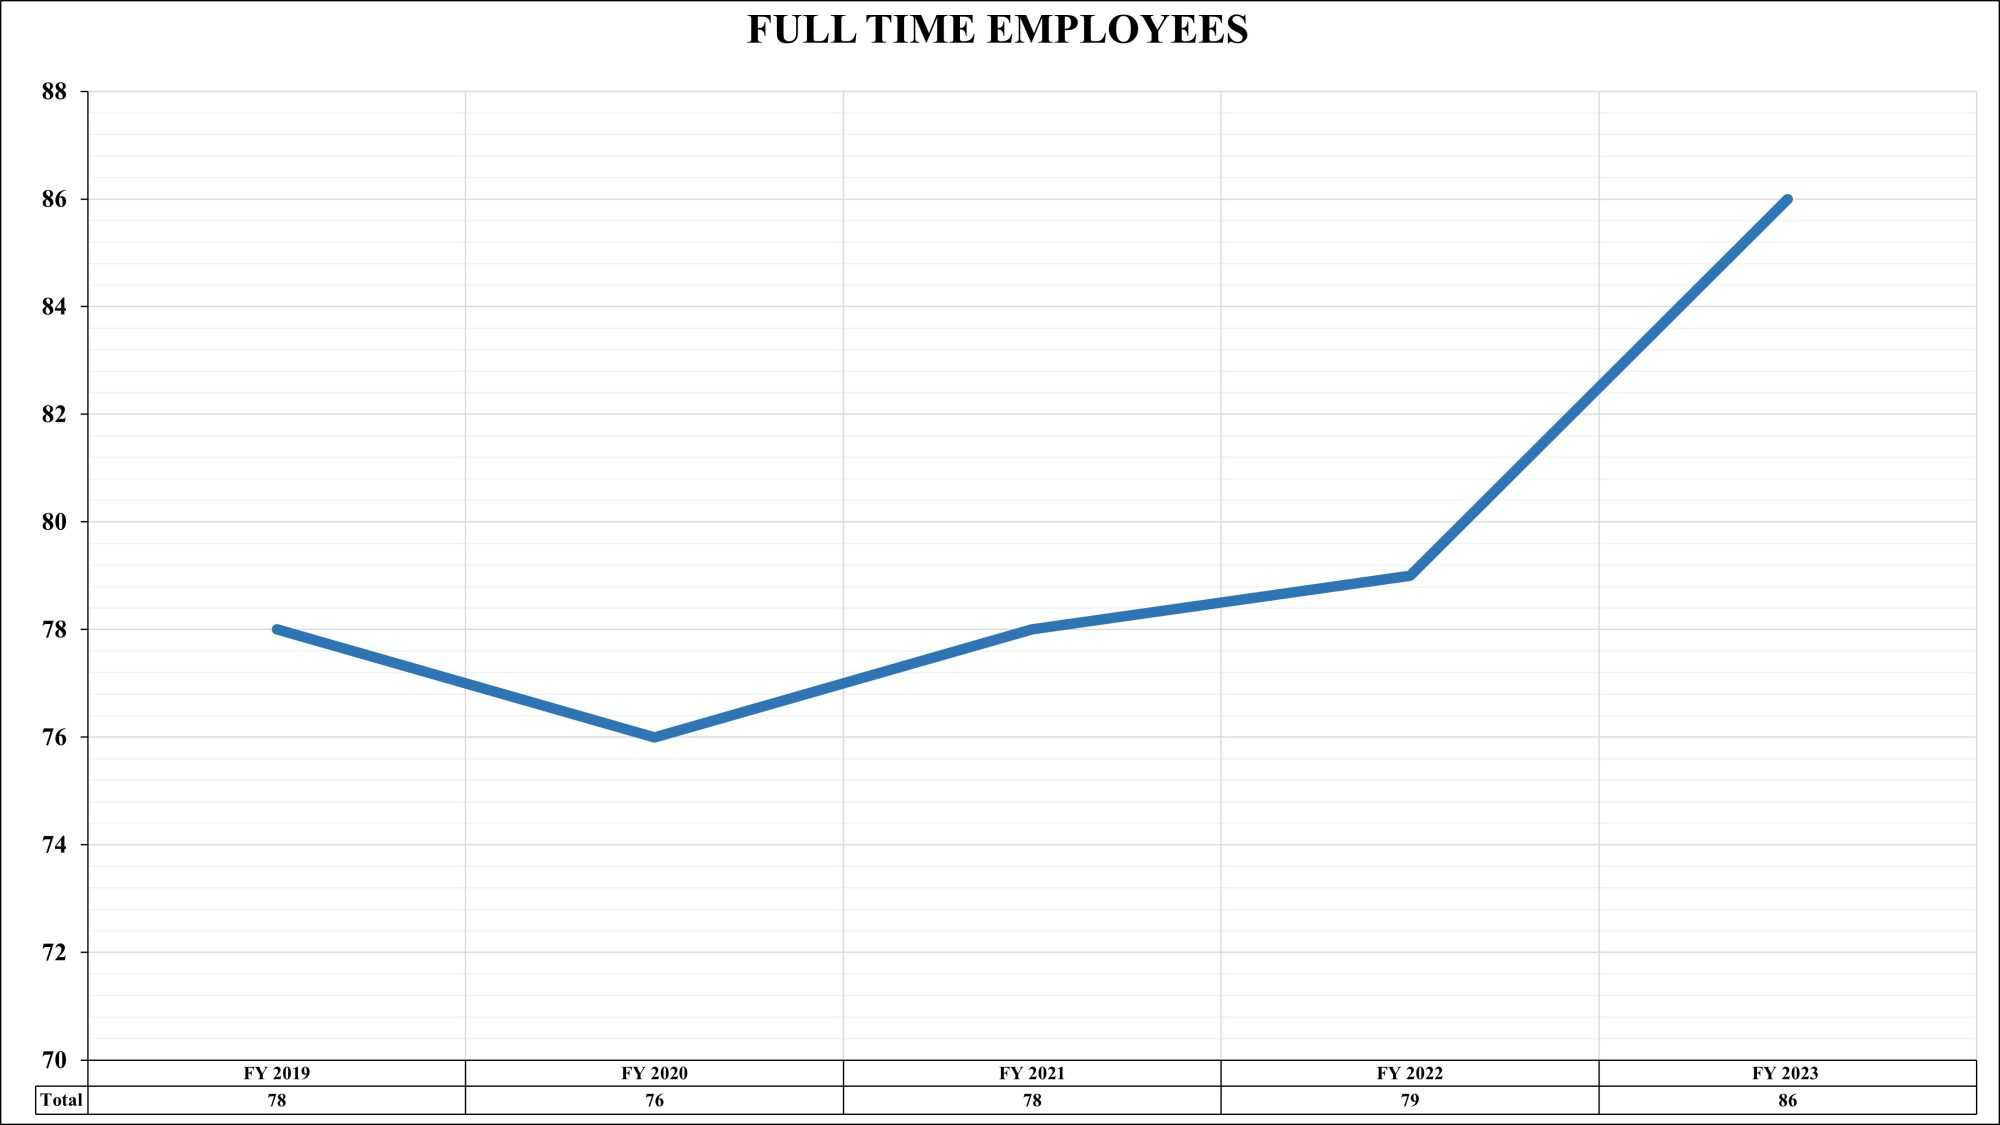
Below are charts to show the past five years of Revenue and Expenses by fund per capita (General Fund, Debt Service Fund and Capital Projects Fund Per number of District Wide Customers) and tax collections per capita per defined area (based on a number of parcels in each defined area) as well as the number of Full Time Equivalent (FTE’s) over the previous five years.